
Observability
Where to look when you want to know how the gateway is doing, and what happened to one request.
4 min readUpdated for v2.4.0Edit on GitHub
:9091/metricsOBLETH_OTEL_ENDPOINTPrometheus metrics
Every gateway replica serves metrics on OBLETH_METRICS_LISTEN (default 0.0.0.0:9091, path /metrics). In Kubernetes, set serviceMonitor.enabled: true if the Prometheus Operator is installed. In Compose, the observability profile adds Prometheus on 127.0.0.1:9090 and Grafana on port 3001 with an Obleth Gateway dashboard; set GRAFANA_ADMIN_PASSWORD in deploy/docker/.env first, or Compose refuses to start it.
Labels stay low-cardinality: no metric carries a tenant, key or model label. The series worth an alert:
| Metric | Watch for |
|---|---|
obleth_requests_total{admission,status} | A rise in status="5xx"; sustained growth of admission="queued" means pools are full |
obleth_queue_depth, obleth_in_flight | Requests waiting for a slot and running, on this replica |
obleth_telemetry_dropped | Any increase: usage rows were lost |
obleth_fairshare_shared_slots_mode{mode} | mode="fallback" at 1: this replica cannot reach Redis and is splitting the limits |
obleth_upstream_attempts_total{outcome} | Growth of failover or exhausted; see Reliability |
obleth_jwks_refresh_total{result="error"} | A sustained rate for one issuer; see the Details below |
Every metric and its labels are in Prometheus metrics.
Request logs
Each request, rejections included, writes one row to the ClickHouse usage ledger: time, tenant, key, model, session, request type, tokens (with cached input tokens when the backend reports them), time to first token, total time, status and cost. Request logs in the dashboard shows them within a few seconds, with filters for status, model, team, key, type and session. Select a request to see what happened in one line, its timeline, every number, the variant it named, and the Helper calls its boons made, each linked back to it.
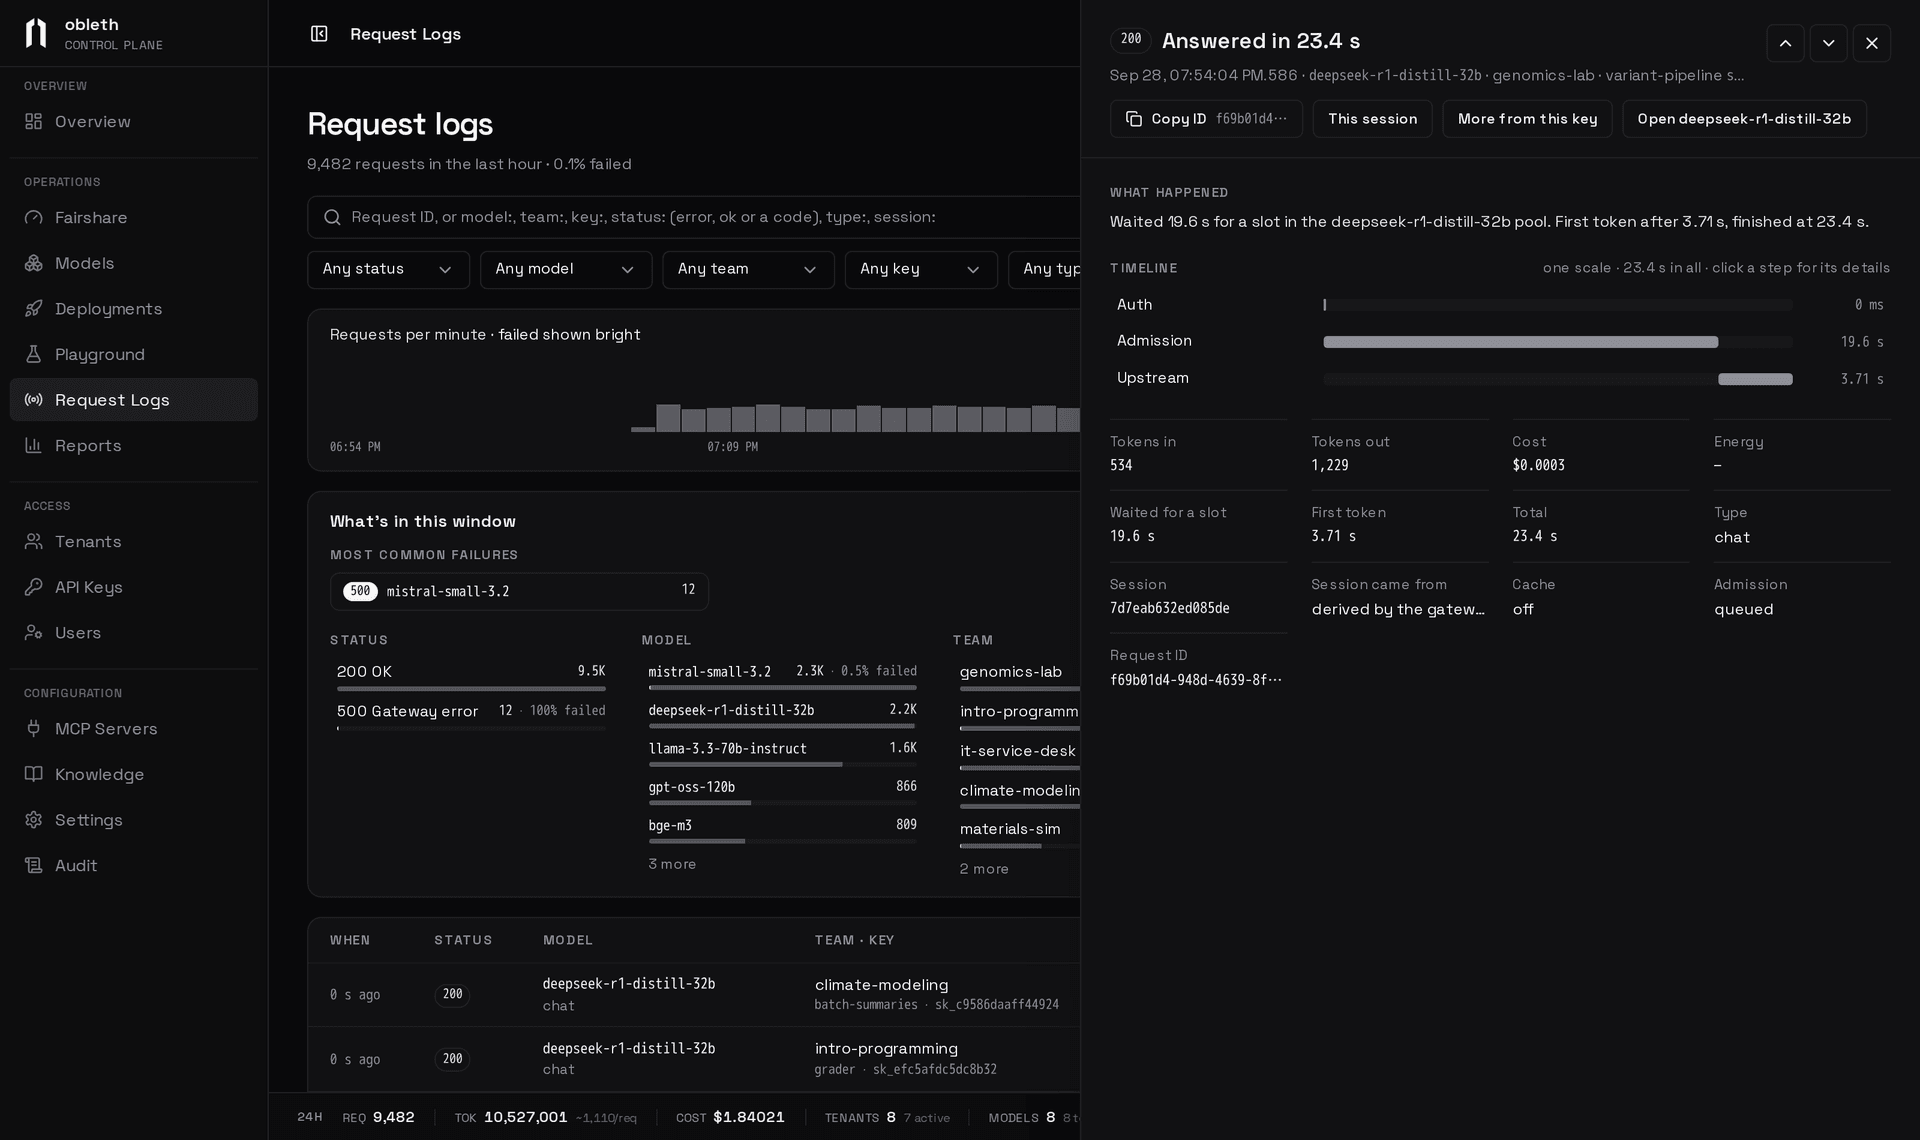
Without tracing, the timeline comes from the log row: the wait for a slot, the time to first token, and the rest. Traced requests show each step, and a step's attributes, such as why the auto router picked the model. See Control plane for the rest of the page.
The same rows are at GET /api/v1/usage/logs on the Management API. Health probes and traffic from tenants flagged synthetic (obench runs, the dashboard's own tests) are excluded from usage and cost figures by default; pass include_internal=true to include them.
Per-request span tracing
Turn on Trace requests for a tenant (all its keys) on the tenant's page, or for one key in its panel on API keys. Or use the API:
curl -X PUT http://localhost:9180/api/v1/tenants/$TENANT_ID/tracing \
  -H "Authorization: Bearer $OBLETH_ADMIN_TOKEN" \
  -H "Content-Type: application/json" \
  -d '{"tracing_enabled": true}'
Use /api/v1/keys/$KEY_ID/tracing for a single key. Traced requests write their spans to the ClickHouse spans table, the log row carries has_trace: true, and GET /api/v1/usage/logs/{request_id}/spans returns them. Spans produced while ClickHouse is unreachable are discarded; unlike usage rows, they are not spilled.
OTLP export
Set OBLETH_OTEL_ENDPOINT to an OTLP/HTTP collector's base URL and every request's spans are exported to {endpoint}/v1/traces under the service name obleth. Unset, there is no tracing overhead.
# Compose .env: the observability profile runs Jaeger, UI on 127.0.0.1:16686
OBLETH_OTEL_ENDPOINT=http://jaeger:4318
In Helm, set obleth.otelEndpoint. Export runs through a background batch processor, so a slow collector does not slow requests. Each request's spans carry session.id and session.id.source (client or derived), so a conversation's turns can be grouped. See Conversations and sessions.
Per-tenant data
Prometheus answers "how is the gateway doing"; per-tenant, per-key and per-model questions go to ClickHouse. The raw usage table keeps OBLETH_USAGE_RETENTION_DAYS (default 180) of rows, and the usage_daily rollup keeps one row per day, tenant, key and model forever. Reports in the dashboard reads both, and the tables are described in ClickHouse usage.
Model health and the Slurm provisioner's state are per-model state, not time series, so they are shown in the dashboard rather than exported: see Health checks and Slurm provisioning.
Spans recorded in ClickHouse
| Span | Covers |
|---|---|
proxy_request | The whole request (root) |
auth_resolve | Key and tenant lookup |
auto_route | The auto router's choice, when used |
admission | The wait for a fairshare slot |
cache_lookup | The response cache check |
boon:vision, boon:knowledge, boon:compression, boon:structured_repair | Each boon that ran |
boon:tool_loop, boon:tool_loop:iter:{n}, boon:image_generation | The gateway's tool loop, per turn, and image generation calls within it |
boon:guardrails_input, boon:guardrails_output | Guardrails scans |
upstream | The upstream call |
upstream_diagnostics | A DNS and port check after a 502 or 504, when Debug upstream failures is on for the model |
verdict:q:<id> | One question of a Verdicts request |
OTLP export has its own span set: proxy_request with auth_resolve, cache_lookup, reserve_budget, reserve_key_budget and upstream_request, and mcp_request for MCP gateway calls.
Identity-token signals
With OBLETH_JWT_ISSUERS set, obleth_jwt_verify_total{result} counts each verification and obleth_jwks_refresh_total{issuer_index,result} each signing-key fetch.
A failed key refresh keeps the last good keys, so nothing breaks until that issuer rotates its signing key. Treat a sustained error rate as a warning with lead time. Each failure also raises a jwks_fetch_failed alert.
On obleth_jwt_verify_total, a spike in a single result points at one misconfiguration: unknown_issuer or bad_audience for a client pointed at the wrong issuer, expired for a client reusing an old token. Rejections are total - ok, not the sum of the other labels, because not_provisioned and provision_failed are counted in addition to ok. See Identity tokens.