64 docs indexed
Benchmark Suite (obench)
Run obench, the Rust benchmark and readiness suite that seeds a demo fleet, drives load, and exits with a PASS/FAIL verdict for your deployment.
obench is obleth's benchmark and readiness suite. It seeds a demo set of models and tenants into the gateway, drives load against it, and exits with a verdict: PASS means the deployment stayed up and served the load at the configured concurrency. obench does not assert fairshare ratios or accounting accuracy — those are things you observe. After every run it prints URLs pointing at the fairshare dashboard and the accounting view in the control plane so you can inspect them directly.
Prerequisites: A Rust toolchain via rustup and the Docker Compose stack running. obench uses rustls for TLS, so OpenSSL does not need to be installed or linked.
Build and run
# build the release binary from the repo root
cargo build --release --manifest-path obench/Cargo.toml

# the binary lands at obench/target/release/obench
./obench/target/release/obench --help
obench has two modes. Pass both --target and --profile (or --no-tui) to run headless; omit either to launch the interactive TUI wizard.
# headless
obench --target demo --profile smoke --all
obench --target demo --profile heavy --model obench-turbo
obench --target live --profile auto  --all

# interactive TUI — no flags or config file needed
obench
The TUI is a guided wizard. It walks you through picking a target, choosing models, and reviewing exactly what will be created before anything is seeded. For live, it asks for the upstream base URL and API key (input hidden), calls GET {base}/models, and lets you multi-select which models to drive. A live confirmation screen shows a cost warning before any real request is sent. Errors — a bad URL, wrong key, or unreachable gateway — show a dismissible message and drop you back to the wizard instead of crashing.
Connection defaults match the local Docker Compose stack and can be set via flags or environment variables:
| Flag | Env var | Default |
|---|---|---|
--admin-base | ADMIN_BASE | http://localhost:9180 |
--admin-token | ADMIN_TOKEN | dev-admin-token |
--proxy-base | PROXY_BASE | http://localhost:8088 |
--ui-base | UI_BASE | http://localhost:3002 |
Target × Profile × Scope
Every run is described by three dimensions:
| Dimension | Values | Meaning |
|---|---|---|
| Target | demo, live | Where to send requests. demo uses the GPU-free benchmark-backend container and is local-only. live uses real upstream APIs and may target a remote gateway. |
| Profile | smoke, light, heavy, extreme, auto, manual | Load intensity and duration. See below. |
| Scope | --all (default), --model <name> | Drive the full demo fleet or a single named model. |
Validity constraint: --target live --profile extreme is blocked. extreme measures the gateway's raw req/s ceiling using tiny 4-token outputs against the GPU-free demo backend, where generation time is negligible. Against live upstreams the generation time dominates and the number is not meaningful. Use --target demo for extreme, or pick auto or heavy for live.
Profiles
| Profile | Concurrency | Duration | Output tokens | Stream | Purpose |
|---|---|---|---|---|---|
smoke | 2 | 30 s | 16 | yes | Check the stack responds at all |
light | 16 | 60 s | 64 | yes | Routine CI / sanity check |
heavy | 64 | 600 s | 128 | yes | Sustained realistic load |
extreme | 2048 | 30 s | 4 | no | Max req/s ceiling (demo only) |
auto | ramp | auto | 4 | no | Self-calibrating (see below) |
manual | 64 | 60 s | 64 | yes | Preset defaults, reshaped by CLI flags |
Per-profile defaults can be overridden with --conc, --duration-s, --output-tokens, --input-tokens (default 256, padding the prompt to ~1 KB), --stream (default true), --capacity, and --max-error-rate.
The auto profile
auto runs a stepped concurrency ramp (32 → 64 → 128 → 256 → 512 → 1024 → 2048), holding each step for 12 seconds after a 2-second warmup. At each step it records throughput, error rate, and p99 TTFB. A knee detector stops the ramp when req/s stops growing cleanly — error rate climbs above 1%, or p99 latency rises more than 1.5× while throughput gains less than 1.1×.
The sustainable concurrency (the last clean step) is reported at the end and written into auto-meta.json together with a replay block:
{
  "sustainable_conc": 256,
  "replay": { "profile": "manual", "conc": 256, "output_tokens": 4, "stream": false }
}
To reproduce the found ceiling, pass the replay values as CLI flags:
obench --target demo --profile manual --conc 256 --output-tokens 4 --all
The obench- demo set
For --target demo, obench seeds the gateway before every run with a canonical set of models, fairshare groups, and tenants whose names all start with obench-. This prefix is the identity contract: anything obench created is removed again on teardown, and anything that already existed is reused, not duplicated.
-
Models (
obench-turbo,obench-base,obench-code,obench-large,obench-embed) are registered against the demo backend. Existing models are updated in place. -
Tenants and fairshare groups are upserted across three groups so a run produces genuine cross-tenant contention:
Tenant Group Weight obench-chatbotobench-chatbot500 obench-chatbot-2obench-chatbot500 obench-api-batchobench-api50 obench-analyticsobench-analytics100 obench-embeddingsobench-api50 -
API keys are minted fresh per run and held in memory only. Stale same-named obench keys are pruned first, so there is no test-key sprawl.
Security model
obench creates real gateway objects through the admin API, so it is built to leave nothing behind:
demois local-only. Because a demo run seeds synthetic models, tenants, and keys,--target demois rejected unless--admin-baseand--proxy-baseresolve to this node (localhost,127.0.0.1,::1,0.0.0.0). To exercise a remote gateway, use--target live.- Keys never touch disk. Minted API key secrets live only in memory for the duration of a run. The saved
.obench.jsonkeeps labels and weights, never secrets. - Automatic teardown. When a run ends — success, stall, or Ctrl-C — obench deletes the API keys it minted, the tenants it created, and (for live) the model route it registered. Objects that already existed and were merely updated are left intact.
Live config
--target live points obench at a remote obleth gateway you do not control. obench acts as a pure black-box client: it never seeds models, never uses an admin token, and never tears anything down. You supply the gateway URL, the model names to drive, and one or more real tenant API keys you already hold.
The interactive TUI builds this for you, so a config file is only needed for headless live runs. For --target live in headless mode, obench reads a JSON config file (default live.config.json, override with --config <path>):
{
  "proxy_url": "https://gateway.example.com",
  "models": ["my-model-a", "my-model-b"],
  "keys": [
    { "label": "tenant-a", "weight": 100, "secret": "${OBENCH_KEY_A}" },
    { "label": "tenant-b", "weight": 200, "secret": "${OBENCH_KEY_B}" }
  ]
}
proxy_url is the OpenAI-compatible base of the remote gateway (with or without a trailing /v1). Each entry in keys[] is a distinct tenant — add two or more to drive genuine fairshare contention. weight shapes how much load each tenant generates; label is cosmetic. The models you list must already exist on the remote gateway.
Any value may contain ${VAR} placeholders, expanded from the environment at load time. A missing variable is a hard error — it is never silently replaced with an empty string, which prevents accidental runs with blank API keys.
Safety warning: live runs send real requests to a real remote gateway using real keys, and every completion may incur cost on that gateway. Key secrets are held in memory only.
Compression savings (obench compression)
A separate subcommand that A/B-measures what the
compression boon actually saves
on your gateway. It sends fixed payload corpora — logs, JSON tables, code,
prose, and repeated context — through /v1/chat/completions in three arms
per sample:
| Arm | How | What it measures |
|---|---|---|
off | x-obleth-boons: off header | Uncompressed baseline |
default | no header | The deterministic passes (lossless JSON, code compaction, dedup, log compaction) |
lossy | x-obleth-boons: lossy header | Adds the lossy prose pass on top |
Savings are read from the gateway's x-obleth-compression response header
(before/after/saved tokens), so the numbers are what the gateway itself
reports, not client-side estimates.
# headless — needs a model with the compression boon and a real API key
obench compression --model my-model --api-key sk_... \
  --admin-token $ADMIN_TOKEN

# or pick "compression savings" on the first screen of the interactive TUI
obench
To keep arms comparable, obench temporarily enables the relevant global boon
settings through the admin API for the duration of the run and always
restores the previous values — on success, failure, or Ctrl-C. Options:
--reps (samples per corpus, default 5), --price-in-per-mtok (for the $
column, default 0.30), --prefill-tps (upstream prefill speeds used to model
the latency crossover, default 500,2000,8000), --min-tokens (compression
threshold used for payload sizing). The Markdown report and meta JSON land in
BENCH_OUT_DIR like every other run.
Note:
Upstream latency savings in the report are modeled from the measured token
savings at the --prefill-tps speeds, not measured end-to-end — the gateway-side
compression overhead (~0 ms deterministic; one helper call for lossy) is
measured for real.
Artifacts
All output goes to BENCH_OUT_DIR (default /tmp/obleth-bench). No secrets are ever written there — API keys live in memory only and are deleted from the gateway during teardown.
| File | Written by | Contents |
|---|---|---|
<profile>-meta.json | every profile | target, profile, scope, completions, req/s, error rate, p50/p99 TTFB, token counts, verdict |
<profile>-timeline.jsonl | --target demo runs | per-10-second rows: in_flight, queued, sampled from the gateway's fairshare state (only observable on the local demo target) |
auto-meta.json | auto profile | above + sustainable_conc, step history, replay block |
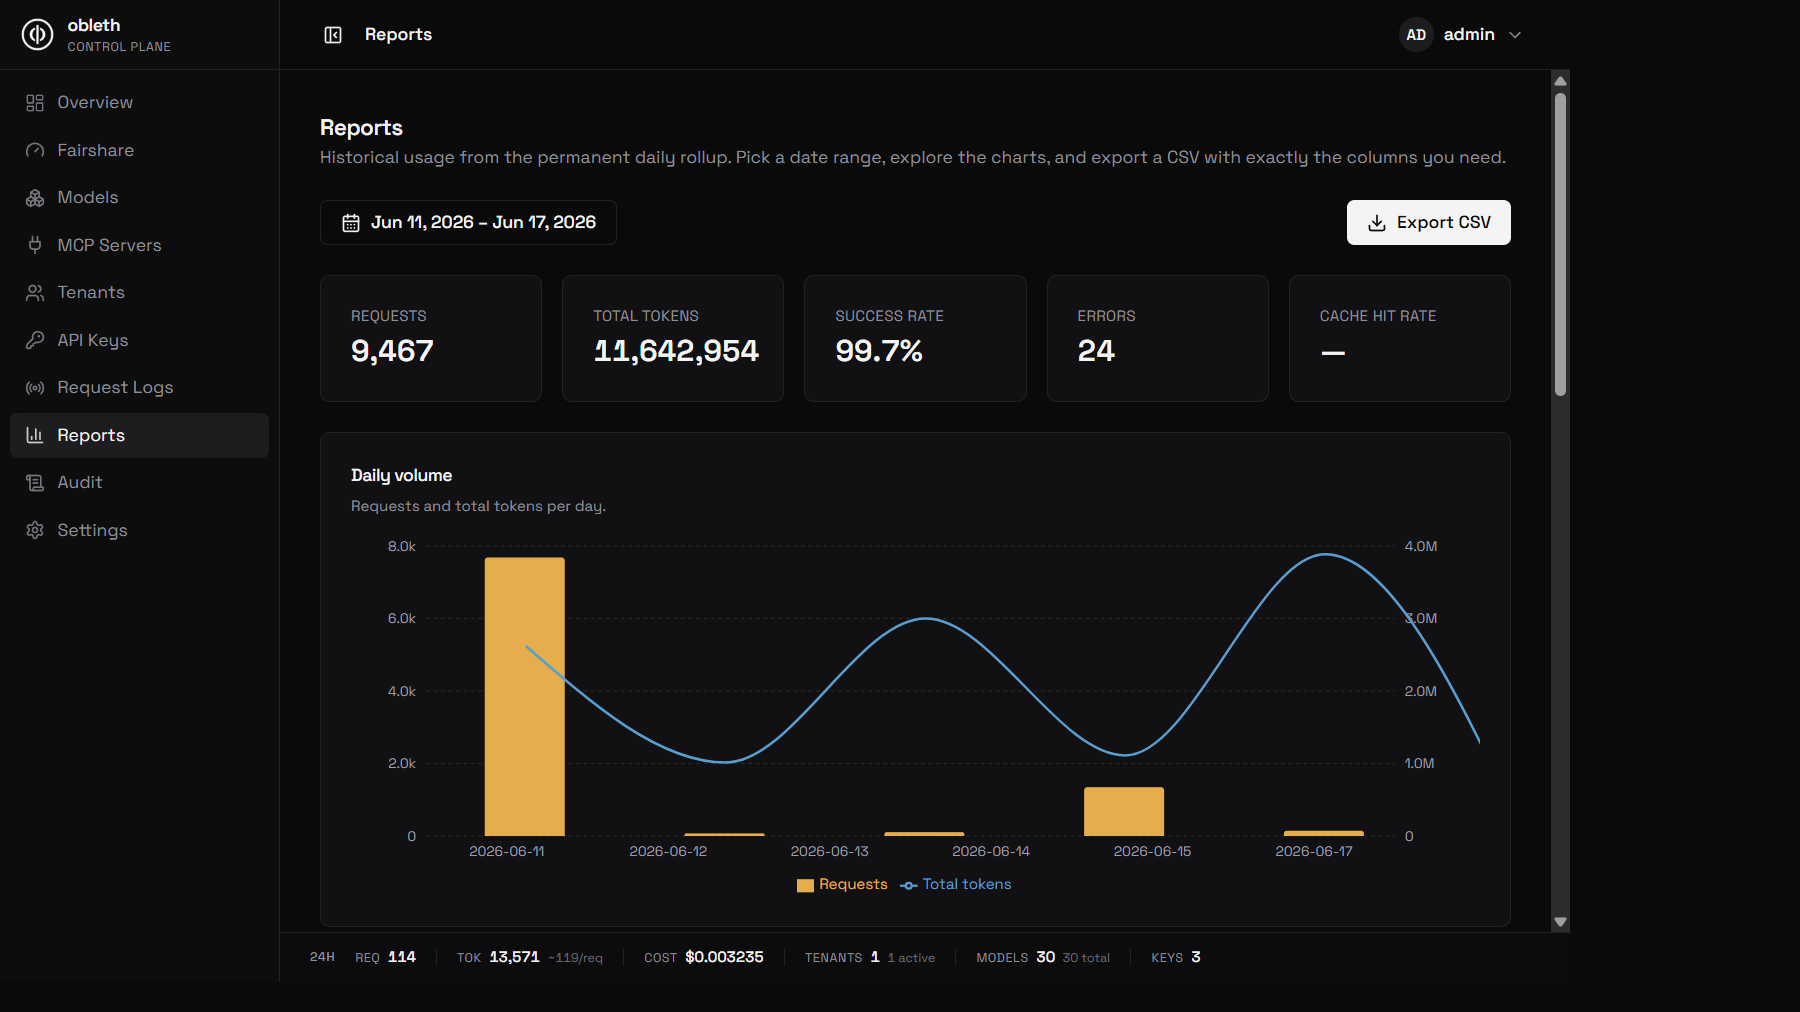
Every request the suite drives is also recorded in the permanent usage ledger. The control plane's Reports page aggregates that ledger so you can confirm the run landed — request counts, total tokens, success rate, and errors per day:
Interpreting results
After every run, obench prints a summary and two control-plane URLs:
verdict: PASS — deployment stayed up and served the load
requests: 4201 ok / 4215 attempts  (70 req/s)
errors: 0.33%   429: 0
ttfb ms: p50=42  p90=88  p99=140
tokens: in 512000 out 268864
watch in the control plane:
  fairshare   http://localhost:3002/fairshare
  accounting  http://localhost:3002/usage
PASS means the deployment stayed up and served the configured load with a client error rate under the threshold (--max-error-rate, default 0.05). A run also fails if a stall watchdog sees two consecutive 10-second windows with zero completions.
Fairshare ratios, per-tenant accounting, and ledger reconciliation are things you observe in the fairshare and accounting views — obench does not assert them automatically.