64 docs indexed
Observability
obleth exposes Prometheus metrics always-on, and OpenTelemetry distributed tracing
obleth exposes Prometheus metrics always-on, and OpenTelemetry distributed tracing when you point it at an OTLP collector.
Prometheus metrics
The data plane serves metrics on OBLETH_METRICS_LISTEN (default 0.0.0.0:9091,
path /metrics). Notable series:
| Metric | Type | Notes |
|---|---|---|
obleth_requests_total{admission,status} | counter | requests by admission outcome + status class |
obleth_tokens_in_total / obleth_tokens_out_total | counter | token throughput |
obleth_ttft_ms / obleth_total_ms | histogram | time-to-first-token + total latency |
obleth_in_flight / obleth_queue_depth | gauge | live concurrency + queue |
obleth_cache_lookups_total{result} | counter | response cache hits/misses |
obleth_cache_tokens_saved_total | counter | tokens served from cache |
obleth_compression_tokens_saved_total | counter | input tokens saved by the compression boon |
obleth_mcp_requests_total{server,status} | counter | MCP gateway calls |
obleth_telemetry_dropped | gauge | usage records dropped under buffer pressure |
In Compose, enable the observability profile for a bundled Prometheus
(:9090) and Grafana (:3001). In Kubernetes, set serviceMonitor.enabled=true
if the Prometheus Operator CRDs are installed.
The bundled Grafana has anonymous access disabled and requires admin
credentials. Set them in deploy/docker/.env before starting the profile —
Compose refuses to start if GRAFANA_ADMIN_PASSWORD is unset:
GRAFANA_ADMIN_USER=admin
GRAFANA_ADMIN_PASSWORD=...   # required; change from the dev example
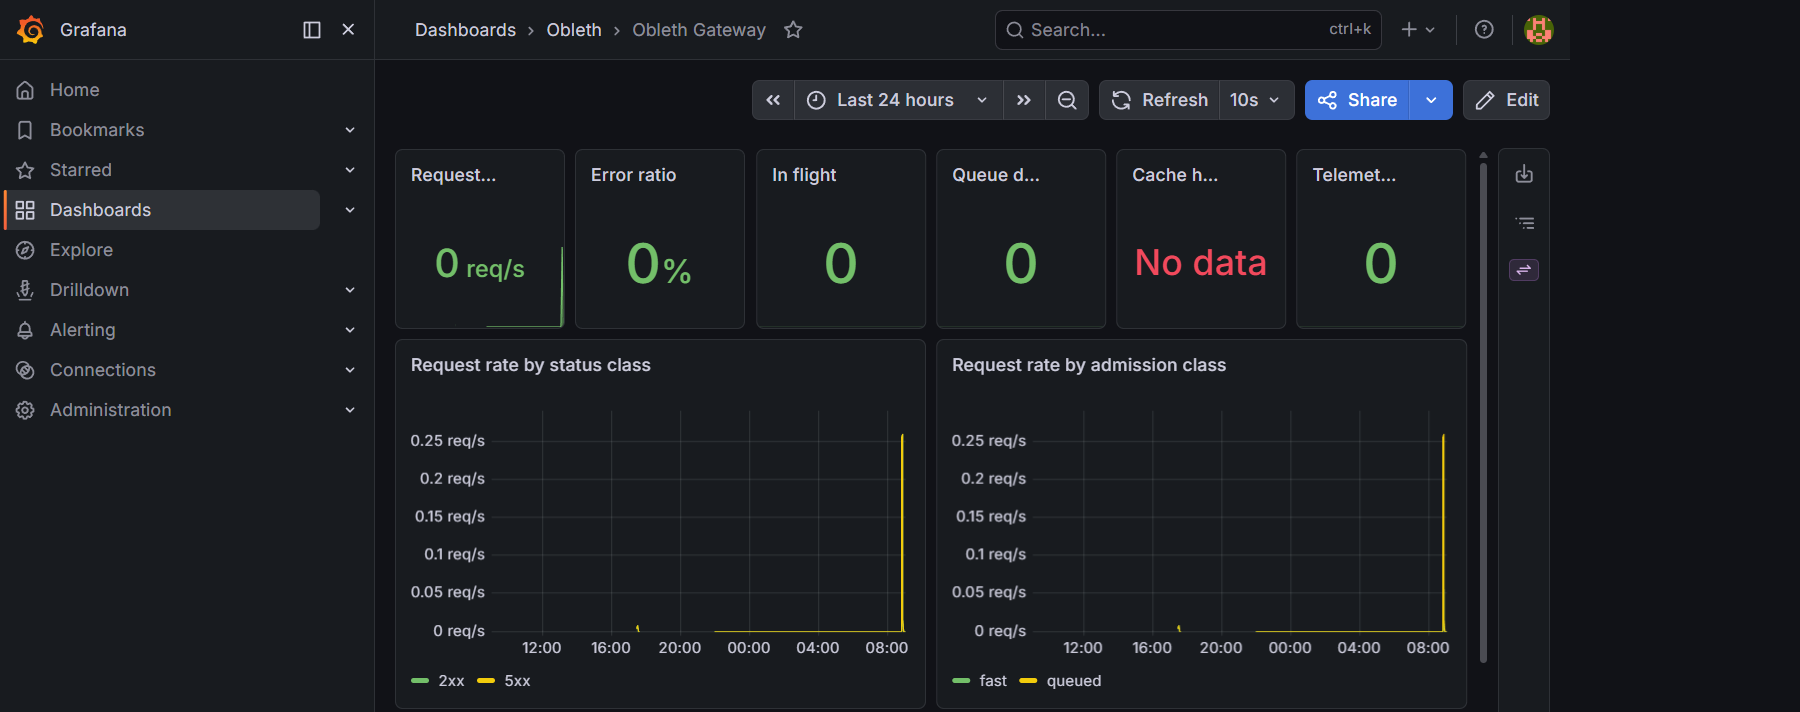
The bundled Obleth Gateway dashboard plots the series above out of the box — request rate by status and admission class, time-to-first-token and total latency percentiles, token throughput, cache results, and live gauges for in-flight, queue depth, and telemetry drops:
Request-level visibility
Prometheus and Grafana give you aggregate throughput, latency histograms, and
scheduler pressure. For individual requests — who called what, when, how
long it took, and what it cost — use the control plane Request Logs page or
GET /api/v1/usage/logs on the Management API.
Each completed request (including rejections) writes one row to the ClickHouse
usage ledger with a timestamp, tenant/key/model, session id (when provided),
request type, tokens, TTFT, total latency, status, and frozen USD cost. The
dashboard live-tails this feed (15s refresh) with filters and keyset pagination.
See Control Plane — Request Logs and Management API — Request logs.
Per-request span tracing
In addition to the per-request usage row, obleth can record a span trace
for each request — a breakdown of how long each pipeline phase took. This is a
ClickHouse-native feature and is separate from the OTLP trace exporter below.
Enabling tracing
Tracing is opt-in and controlled by the tracing_enabled flag, which can be
set at the tenant level (covers all of its keys) or per API key:
# Enable tracing for a tenant (all keys inherit it)
curl -X PUT http://localhost:9180/api/v1/tenants/$TENANT_ID/tracing \
  -H "Authorization: Bearer $TOKEN" \
  -H "Content-Type: application/json" \
  -d '{"tracing_enabled": true}'

# Enable tracing for a single key
curl -X PUT http://localhost:9180/api/v1/keys/$KEY_ID/tracing \
  -H "Authorization: Bearer $TOKEN" \
  -H "Content-Type: application/json" \
  -d '{"tracing_enabled": true}'
The dashboard also exposes these toggles on the Tenants and API Keys pages.
What is recorded
When tracing_enabled is set, each request writes its spans to the ClickHouse
spans table via the same non-blocking telemetry sink used for usage rows.
Spans recorded per request:
| Span | Parent | Description |
|---|---|---|
proxy_request | — | Root span; total request duration |
auth_resolve | proxy_request | API key + tenant resolution (moka → Redis) |
auto_route | proxy_request | Auto-router model selection (when active) |
admission | proxy_request | Fairshare semaphore acquisition |
cache_lookup | proxy_request | Response cache check |
boon:vision | proxy_request | Vision boon image-injection time |
boon:tool_loop | proxy_request | Gateway MCP tool loop; attributes include turns and tools used |
boon:tool_loop:iter:{n} | boon:tool_loop | Per-turn breakdown: tool_ms (MCP execution) and model_ms (re-dispatch) |
boon:compression | proxy_request | All compression passes; json_compacted, dedup_refs, lossy_segments, tokens_saved, before/after tokens |
boon:guardrails_input | proxy_request | Guardrails scanning of the request |
boon:guardrails_output | proxy_request | Guardrails scanning of the response |
upstream / dispatch | proxy_request | Upstream call latency |
Querying spans
The has_trace field on each GET /api/v1/usage/logs row is true when at
least one span exists for that request. Fetch the full span set for one request:
GET /api/v1/usage/logs/{request_id}/spans
[
  {
    "request_id": "a1b2c3d4-...",
    "span_name": "proxy_request",
    "parent_span": "",
    "start_ms": 1749427821000,
    "duration_ms": 1243,
    "status": "ok",
    "attributes": "{}"
  },
  {
    "request_id": "a1b2c3d4-...",
    "span_name": "auth_resolve",
    "parent_span": "proxy_request",
    "start_ms": 1749427821001,
    "duration_ms": 2,
    "status": "ok",
    "attributes": "{}"
  }
]
Request detail panel
On the Request Logs page in the dashboard, traced requests show a small trace icon. Clicking a row that has a trace opens the Request Detail panel, which renders the spans as a timeline waterfall — each phase is drawn proportionally to its duration so you can immediately see where latency went. The panel also includes the full usage summary (tokens, cost, admission, cache status) alongside the trace.
OTLP tracing
Tracing is fully gated on OBLETH_OTEL_ENDPOINT. Unset, there is zero tracing
overhead and obleth logs to stdout as usual. Set it to an OTLP/HTTP collector
base URL and obleth exports spans to {endpoint}/v1/traces.
# Docker Compose (.env)
OBLETH_OTEL_ENDPOINT=http://jaeger:4318
# Helm values
obleth:
  otelEndpoint: http://my-collector:4318
The Compose observability profile ships Jaeger all-in-one (OTLP enabled) with
its UI on http://localhost:16686.
Spans
Each request produces a proxy_request span with child spans for the pipeline
phases:
auth_resolve— API key resolution (moka → Redis)cache_lookup— response cache checkreserve_budget— atomic token-budget reservationupstream_request— the call to the inference backend
MCP gateway calls produce an mcp_request span tagged with the server name.
Each request's spans also carry a session.id attribute (with
session.id.source = client or derived), so a whole conversation's spans can
be grouped in your tracing backend rather than viewed one turn at a time. The
same id is recorded on the usage row. See
Conversations & Sessions.
Notes
- obleth uses the OTLP/HTTP (protobuf) exporter with a background batch processor, so trace export never blocks the request hot path.
- The service name is reported as
obleth. - Point
OBLETH_OTEL_ENDPOINTat any OTLP-compatible backend (Jaeger, Tempo, an OpenTelemetry Collector, or a vendor endpoint).