64 docs indexed
Model Health
Persisted model health checks, manual probes, maintenance windows, and Slack alerts.
Model health checks judge each registered route without spending tokens. For
every model obleth first looks for a passive signal — recent real client
traffic in the ClickHouse usage ledger — and only falls back to an active
liveness probe (GET {api_base}/models) when a model has seen no traffic. The
probe is token-free and never runs a real inference request, so checking a model
never consumes a provider budget.
A healthy result covers the parts that matter to operators:
- the model registry lookup and route configuration;
- the configured upstream being reachable; and
- the upstream actually advertising the route's
upstream_model(when its/v1/modelslist enumerates models).
Transient conditions — an overloaded upstream, a single network blip, or a
/v1/models endpoint that doesn't list the model — are classified as degraded
rather than unhealthy, so a working model doesn't flap to "down" and fire false
alerts.
Passive signal vs active probe
| Source | When used | Result |
|---|---|---|
| Passive (ClickHouse usage, last 300s) | Model has recent client traffic | healthy if any 2xx; unhealthy if only 5xx; inconclusive if only 4xx (falls through to probe) |
Active liveness (GET {api_base}/models) | No recent traffic, or passive was inconclusive | healthy/degraded/unhealthy from the probe response |
The active probe retries once on 408/429/5xx or a network error before
recording a result. A 2xx that lists the model is healthy; a 2xx that
doesn't advertise it is degraded (many shared gateways omit models from
/v1/models); 401/403 is unhealthy; other inconclusive responses are
degraded.
Per-endpoint health
When a model defines multiple endpoints,
the worker probes each enabled endpoint independently with the same
GET {api_base}/models liveness check and records a per-endpoint
health_status. The data plane only routes to endpoints that are enabled and not
explicitly unhealthy, so a dead cluster drops out of rotation on its own while the
rest of the model keeps serving. The model is reported fully down only when every
endpoint is unhealthy.
Models with no static api_base (dynamic endpoints)
Slurm-provisioned models have no static
api_base — their live URLs live entirely in the endpoint pool, which changes as
replicas come and go. For these, the model-level status is derived from the
endpoint pool instead of from an empty base: healthy if any live endpoint is
healthy, degraded if only degraded endpoints remain, and unhealthy if every
live endpoint is down or none are registered. Because the endpoints are probed
from the gateway, a Slurm replica that the provisioner promoted can still report
unhealthy here if the gateway itself cannot reach the node — see the
Slurm troubleshooting notes.
Dashboard
Open Models in the control plane.
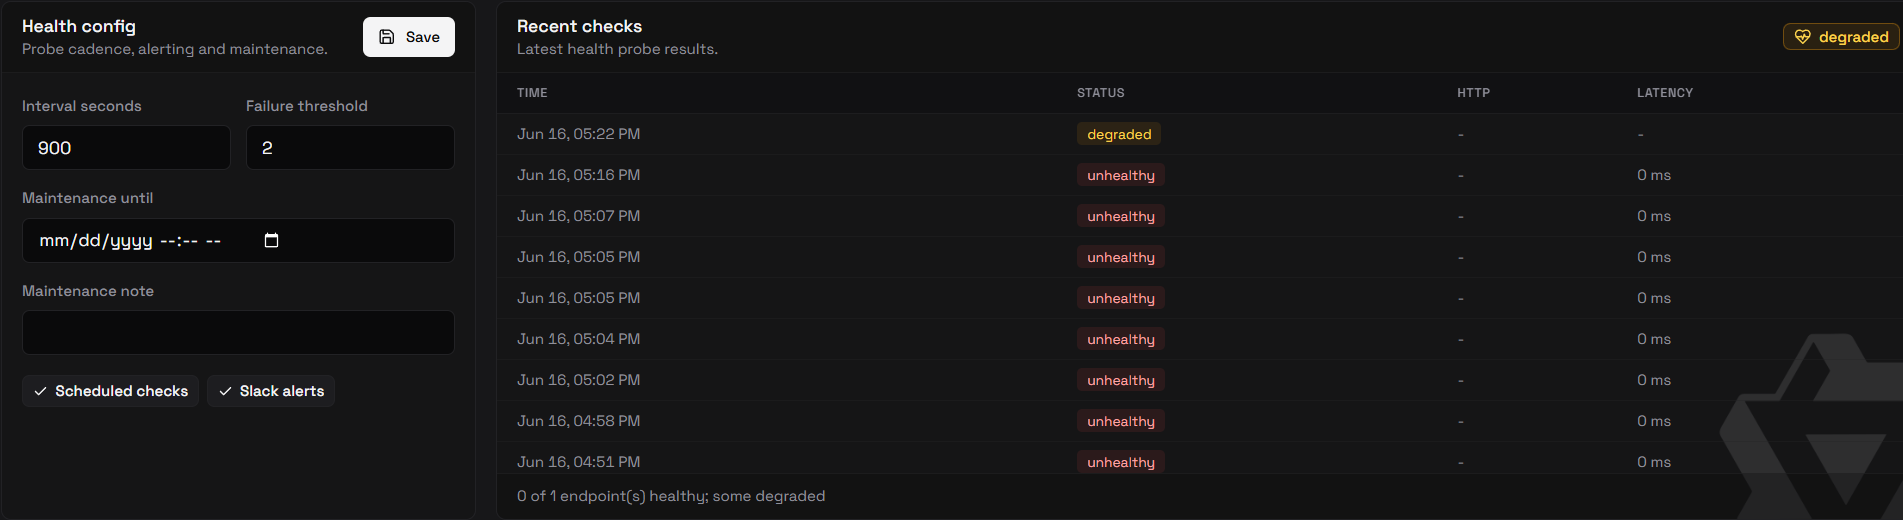
The compact table shows each production model's latest health status and last check latency. Click a row to expand details:
- route fields and model status;
- admission weight and per-model max in-flight slots;
- health config, including interval, failure threshold, alerts, and maintenance;
- recent latency trend; and
- recent check history.
Benchmark fixture endpoints such as benchmark-endpoint are hidden by default.
Use Show benchmark when you need to inspect or check them.
Manual checks
Run one check:
curl -X POST http://localhost:9180/api/v1/models/$MODEL_ID/health/check \
  -H "Authorization: Bearer $TOKEN"
Run checks for eligible models:
curl -X POST http://localhost:9180/api/v1/models/health/check \
  -H "Authorization: Bearer $TOKEN"
Bulk checks skip routes that are disabled, hidden for maintenance, or have checks disabled.
Scheduled checks
The worker is enabled by default:
OBLETH_MODEL_HEALTH_ENABLED=true
OBLETH_MODEL_HEALTH_INTERVAL_SECS=900
OBLETH_MODEL_HEALTH_TIMEOUT_SECS=30
OBLETH_MODEL_HEALTH_RETENTION_DAYS=30
Checks are claimed with Postgres row locking, so multiple Management API replicas can run safely without a single in-memory leader. Per-model jitter keeps large fleets from checking every route at once.
Alerts
Slack alerts use the existing incoming webhook config:
OBLETH_SLACK_WEBHOOK_URL=https://hooks.slack.com/services/...
OBLETH_SLACK_ALERT_MIN_INTERVAL_SECS=300
Each model has its own failure threshold, default 2. obleth sends one down
alert when the threshold is reached and a recovery alert when the model becomes
healthy again.
The health badge tracks the same threshold as the alert: a model only reads
unhealthy once it has crossed its failure threshold — not on the latest single
probe — so the badge flips exactly when an alert would fire rather than flickering
on one bad check. Combined with the active probe's extra retry-with-backoff, a
brief blip (common on cold Slurm nodes) doesn't register as down at all.
Alerts are suppressed when:
- alerts are disabled for that model;
- the model is in an active maintenance window; or
- the route itself is disabled.
Failed checks are still stored during maintenance, so the history remains useful after the window ends.