64 docs indexed
Control Plane
The obleth Next.js dashboard: what it shows, how to configure it, and how it connects to the Management API.
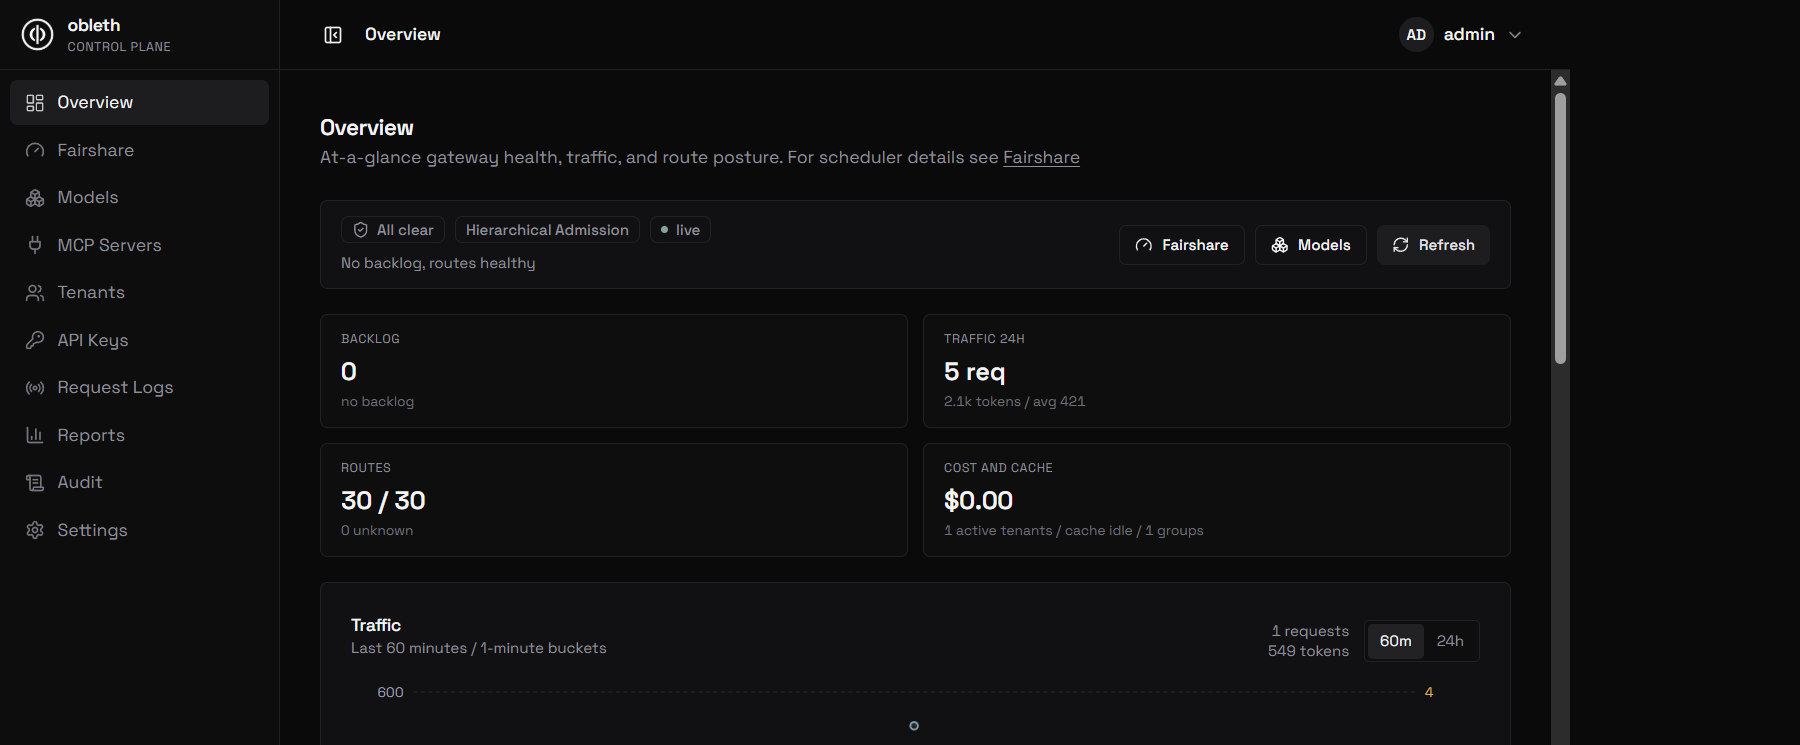
The control plane is a Next.js dashboard that consumes the obleth Management API exclusively — it never touches Postgres, Redis, or ClickHouse directly. All domain logic, validation, and audit logging is in one place (the Management API), and the dashboard is just a UI.
Accessing the dashboard
| Environment | URL |
|---|---|
| Docker Compose (dev) | http://localhost:3002 |
| Kubernetes (Helm default) | http://localhost:3000 (via port-forward) or your Ingress host |
In the Docker Compose stack, the dashboard uses dev-admin-token by default. Change it by setting OBLETH_ADMIN_TOKEN and OBLETH_ADMIN_BASE_URL in the control-plane environment.
What the dashboard shows
Overview
- Live system stats: global
in_flight,queued,max_in_flight - Token throughput charts (input/output tokens per time bucket)
- Request rate by admission class (
fast,queued,rejected)
Tenants
- List of all tenants with weight, TPM quota, and group
- Create, view, and delete tenants
- Live weight change (calls
PATCH /api/v1/tenants/{id}/weight) - Quota update (calls
PUT /api/v1/tenants/{id}/quota) - Per-tenant usage breakdown from ClickHouse
API Keys
- List all keys with prefix, tenant, status
- Create a new key for any tenant (secret shown once)
- Disable/enable and delete keys
- Last used column plus rolling requests/tokens per key (last 30 days),
backed by
GET /api/v1/usage/keys/summary. Keys with no traffic in the window show "Never". For a single key's exact last-used time across full retention, callGET /api/v1/keys/{id}/usage.
Models
- Compact model registry with click-to-expand detail rows
- Create, update, and delete model routes, including descriptions, per-token costs, context windows, and capability flags
- Select a model type (
chat,embedding,audio_transcription,audio_speech, orimage); the form reveals the cost fields that apply to that modality (cost_per_image,cost_per_character) and shows a type badge on each row - Edit route fields, admission weight, per-model max in-flight slots, capacity mode (
static/tuned), and status - Auto-tune capacity (chat and embedding only): ramp probe against the upstream, per-step curve table, one-click apply — see Capacity Auto-tune
- Per-token cost fields render as plain decimals (e.g.
0.00000008) instead of scientific notation, so they stay readable and editable - Enable/disable and configure the response cache per model
- Set Energy slots per node for energy accounting (
0= model opted out) - Model health badges, manual checks, scheduled-check settings, maintenance windows, and recent check history
- Bulk Import/Export of model routes as a YAML/JSON template (see below)
- Benchmark fixture endpoints are hidden by default behind the
Show benchmarktoggle - Cache stats: 24h hit rate, hits, misses, tokens saved
- Slurm-provisioned models: when Slurm is enabled in Settings, the New model dialog lets you choose between Static endpoint (the normal
api_base+api_keyflow) and Slurm provisioned (Apptainer image + launch command; no static endpoint). Slurm-provisioned models show a Provisioning tab with replica state, target count, and spec editing. Non-Slurm models never show this tab. See Slurm Provisioning.
Importing and exporting models
The Models page has Import and Export buttons for managing routes in bulk — useful for backups, moving a model set between environments, or seeding a fresh deployment.
Export downloads a JSON file (obleth-models-<date>.json) containing every registered route. Server-assigned fields (id, timestamps) and the upstream api_key are intentionally omitted, so the export is safe to share and never leaks secrets.
Import accepts the obleth models template only — a file with a top-level models: list, in either YAML or JSON. Foreign formats (LiteLLM model_list, Kubernetes ConfigMaps) are not accepted. After you pick a file, the dashboard shows a preview that diffs the file against the current registry before anything is written:
- Each model is labelled new (will be created) or update (matched by
model_nameand updated in place) - A summary line reports
N models in file / X new / Y to update - Nothing is applied until you click Confirm import; Cancel discards the file
On import, routes are matched by model_name. Fields omitted from a model entry fall back to existing values on update, or to sane defaults on create. Per-model failures (e.g. a rejected api_base) are collected and shown individually in the result banner rather than aborting the whole import.
Required fields per model: model_name, upstream_model, api_base. Everything else is optional:
# obleth models import template
models:
  - model_name: qwen3-235b-a22b-instruct-2507
    description: Qwen3 235B A22B instruct
    model_type: chat             # chat | embedding | audio_transcription | audio_speech | image
    upstream_model: asuair/qwen3-235b-a22b-instruct-2507
    api_base: https://openai.rc.asu.edu/v1
    api_key: sk_1234            # optional; omit to leave unset / unchanged
    input_cost_per_token: 0.000000071
    output_cost_per_token: 0.0000001
    context_window: 262144
    admission_weight: 100
    max_in_flight:              # blank = no cap
    supports_function_calling: true
    supports_system_messages: true
    supports_response_schema: true
    supports_tool_choice: true
    enabled: true
    tags: [general, long-context]
    boons: []                    # e.g. [vision, structured_output]; gateway capabilities granted to a model that lacks them natively
    tool_servers: []             # registered MCP servers whose tools this model may use (gateway tool loop)

  # Non-chat routes set model_type and the cost field for their modality:
  - model_name: qwen3-embedding-8b
    model_type: embedding
    upstream_model: Qwen/Qwen3-Embedding-8B
    api_base: https://openai.rc.asu.edu/v1
    input_cost_per_token: 0.00000001
    enabled: true
  - model_name: sdxl
    model_type: image
    upstream_model: stabilityai/stable-diffusion-xl-base-1.0
    api_base: https://openai.rc.asu.edu/v1
    cost_per_image: 0.02         # billed × n
    enabled: true
  - model_name: qwen3-tts
    model_type: audio_speech
    upstream_model: Qwen/Qwen3-TTS
    api_base: https://openai.rc.asu.edu/v1
    cost_per_character: 0.000015 # billed per input character
    enabled: true
Routing tags use the fixed auto-router vocabulary: coding, general, reasoning, math, vision, long-context, fast, creative. Only chat routes participate in auto routing. See Multi-modal Models for the modality fields.
Note: By default, internal cluster
api_basehosts (e.g.*.svc.cluster.local) are allowed — private/LAN addresses are permitted for local-first deployments. Link-local and cloud-metadata targets are always blocked. If you run strict SSRF mode (OBLETH_BLOCK_PRIVATE_NETWORKS=1), add the pod CIDR toOBLETH_ALLOWED_PRIVATE_CIDRS(e.g.10.0.0.0/8); blocked hosts surface as per-model errors in the import result banner.
Fairshare live view
- Real-time snapshot of the scheduler: per-tenant
in_flight,queued,served_tokens,share_score - Per-group breakdown (hierarchical mode)
- Auto-refreshes every few seconds
MCP Servers
- Register, update, and delete MCP server entries
- Toggle enabled/disabled
Usage & Costs
- Token usage aggregated by tenant, key, or model
- Time-series charts bucketed by 5-minute intervals
- Cost breakdown summed from each request's USD cost, frozen at completion time (so editing a model's price never rewrites past spend)
Request Logs
A live, per-request view of traffic as it lands in the ClickHouse usage ledger.
Unlike Overview and Reports, which read aggregates, Request Logs returns
individual rows — one per completed request (successes and rejections like 429/403)
with a timestamp, latency, cost, and tenant/key attribution.
- Live Tail — auto-refreshes every 15 seconds (toggle off to pause and page through history)
- Time window — last 15 minutes, hour, 24 hours, or 7 days
- Filters — team (tenant), model, request type, status (
success/error), Traced only (show only requests with recorded spans) - Search — prefix match on the internal
request_idUUID - Pagination — keyset cursor when Live Tail is off (Previous / Next)
Columns shown: Time, Type, Status, Model, Session, Request ID, Cost, Energy (Wh, when energy accounting is enabled), Tokens, TTFT, Duration, Team, Key. Team and key names are resolved from Postgres; the ledger itself stores only UUIDs. The detail view adds the request's energy cost and CO₂.
Request type is derived from the API path (chat, embedding, audio,
image, completion, responses, rerank, moderation, or other).
Session ID groups related requests when the client supplies one. obleth checks, in order:
x-obleth-session-idorx-session-idheadersession_idin the JSON bodymetadata.session_idin the JSON bodyuserin the JSON body (OpenAI convention)
Values are trimmed and capped at 200 characters. If none are present, the Session column is empty.
Request Detail and span tracing
Requests that were traced (i.e. the key or tenant had tracing_enabled set)
show a small trace icon in the row. Clicking any row opens the Request Detail
panel, which shows:
- Span waterfall (traced requests only) — a proportional timeline of every
pipeline phase: auth, admission, cache lookup, boon processing (vision, tool
loop, structured repair), upstream call, and any MCP tool iterations. Each span
is colour-coded by type (cache = amber, upstream = blue, boons = green, errors
= red). The waterfall labels map spans to human-readable names (
auth_resolve→ "Auth",boon:tool_loop:iter:0→ "Iter 0", etc.). - Usage summary — full token counts, cost, admission class, cache status, latency, tenant, and key, regardless of whether the request was traced.
To enable tracing, toggle tracing_enabled on the relevant tenant (Tenants page)
or API key (API Keys page). See Per-request span tracing.
The page calls GET /api/v1/usage/logs
via the control-plane BFF (/api/live/usage/logs). Raw rows are retained for the
configured retention window (default 180 days); the permanent usage_daily rollup
behind Reports is unaffected.
Reports
Long-range usage analytics backed by the permanent usage_daily rollup, so the
Reports page keeps full history even after the raw ledger has been pruned to its
retention window. It calls GET /api/v1/usage/daily.
- Summary cards: total requests, total tokens, spend (USD), success rate, cache hit rate, and — when energy accounting is enabled — energy (kWh) and CO₂
- Filter by team and API key — the filters re-scope every card, chart, table, and export, so "what did this course spend this month" is one dropdown away
- Time series of requests and tokens over the selected date range
- Top models breakdown and success/error split
- Average TTFT and end-to-end latency over time
- Breakdown table grouped by day, team, key, or model — chargeback groupings sort by spend, and key rows show the key's name with its prefix
- Export CSV of the daily rollup — inherits the active team/key filter, defaults its row grouping to the table's current grouping (per key + model, day, team, key, or model), and includes Spend (
cost_usd) and key name by default alongside the token, latency, and energy columns (Energy (kWh), CO₂ (g), Energy cost (USD))
Audit log
- Timeline of all config mutations: who changed what and when
- Filterable by action type and entity
Settings
- Configure operational alerting for Slack and email (SMTP)
- Set the alert cooldown (min-interval) to suppress duplicate alerts
- Send a test alert to verify channel credentials before relying on them
- Set the raw-usage retention window (days of per-request history kept before pruning); the
usage_dailyrollup behind Reports is unaffected - Slurm tab: enable the Slurm provisioner system-wide, configure the slurmrestd connection (URL, API version, user, JWT), view JWT expiry, and run a live connection test (JWT health + slurmrestd ping) — see Slurm Provisioning
- Energy tab: enable energy & carbon accounting, point it at your Prometheus power metrics, set $/kWh, gCO₂/kWh, and PUE, and run a live Test query ("X kW across N nodes") before enabling
- Changes apply to the running gateway immediately — no restart
Configuration
| Variable | Purpose |
|---|---|
OBLETH_ADMIN_BASE_URL | Base URL of the Management API (e.g. http://localhost:9180) |
OBLETH_ADMIN_TOKEN | Admin bearer token for all Management API calls |
DASHBOARD_ADMIN_EMAIL | Email for the break-glass admin (sign-in is email-based) |
DASHBOARD_PASSWORD | Break-glass admin password (or DASHBOARD_PASSWORD_HASH) |
DASHBOARD_SESSION_SECRET | Session cookie signing secret (≥32 chars; change in production) |
DATABASE_URL | Postgres URL for the auth tables (same DB as the gateway) |
OIDC_PROVIDERS | Optional JSON array enabling OIDC SSO — see the Dashboard SSO guide |
In the Docker Compose stack, these are configured via deploy/docker/.env.